You will spend a lot of hours staring at stock charts. The candles tell a story and give you clues as to what will come next.
Candle Color
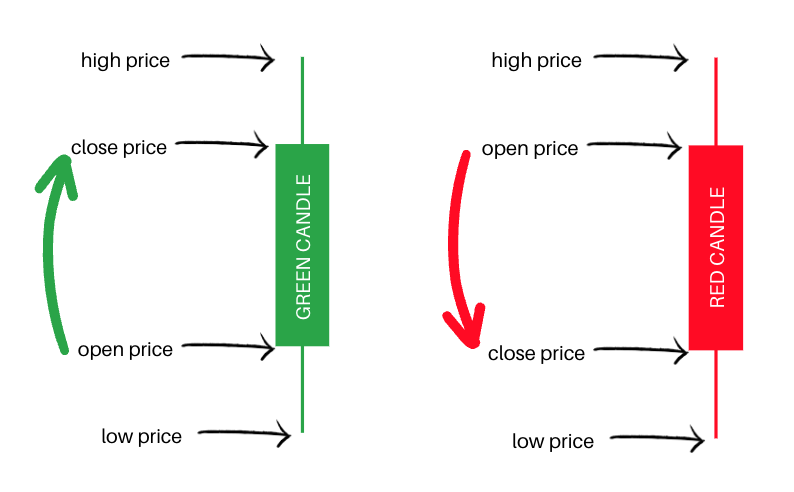
When the price closes at the end of the minute higher than when it opened, the candle will be green. When the price closes lower, the candle will be red. Your chart program will allow you to change the color of the candles. Pick something you like and stick with it.
Candle Wick
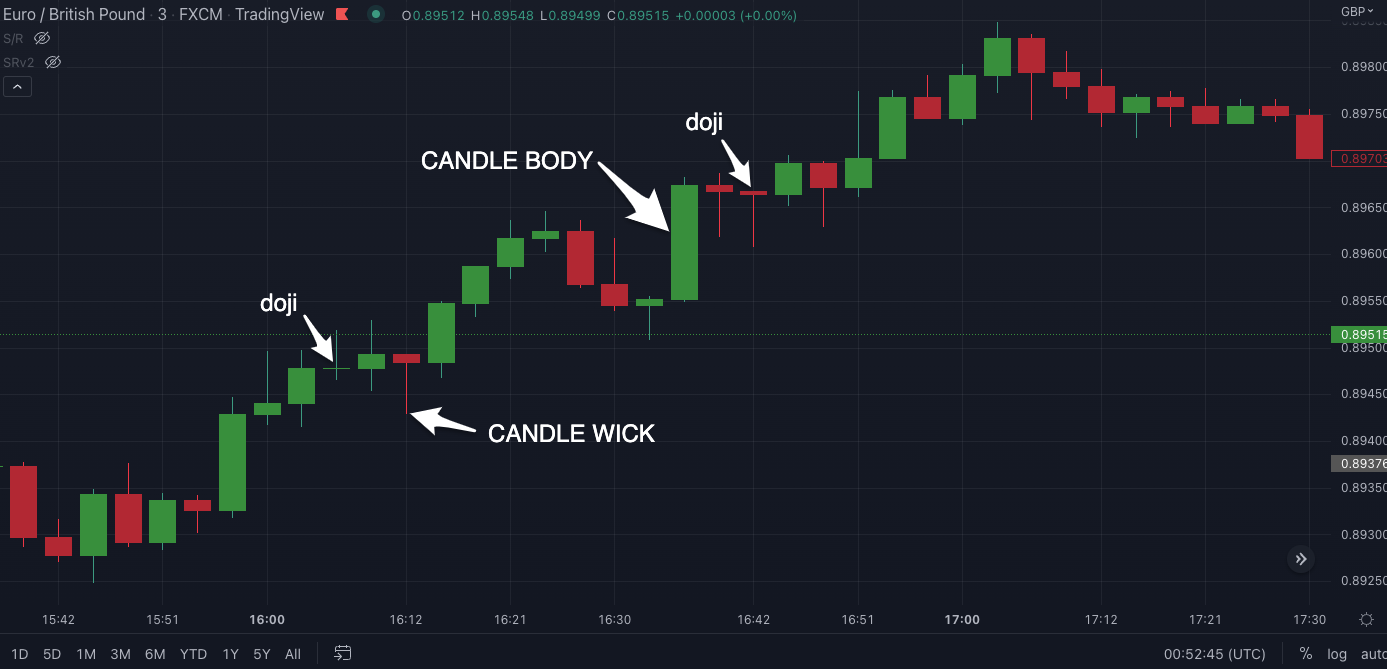
The little stick above or below is called the wick. It shows you how high or low the price reached within the candle time frame. The bottom and top of the candle body show you the open and close price. If you see a small candle body and a large wick going in both directions, it means the price has jumped high and low but settled back close to the opening price of the candle. Every little clue will help you as you begin to analyze the chart movement. When you see a lot of long wicks, you know the chart is unstable and could go in either direction.
Time Frame
When you set up your chart view, you will select a time frame for the length of the candles. I spend most of my time looking at 1 minute candles. Some of my strategies call for me to switch between time frames and get a look over different periods. I start with 1 minute candles. That means that each candle represents 1 minute.
Candle Pressure
When you look at a 1 minute candle and see it pulsing up and down it is called candle pressure. If you see a candle pushing up, dropping down, and pushing up again, over and over again, you can see there is a lot of up pressure in that candle. This gives you insight into where the chart strength is moving. For example, when you see a candle shoot up green all of the sudden and then stop at a point and begin to struggle to go higher, this is a sign that it may drop hard on the next candle.
Think about a weight lifter. He may pick up a huge weight and thrust it above his head, then his body begins to shake under the weight and it won’t be long until he drops the weight down. This is kinda what it is like when reading candle pressure. You can see when a price is about to jump or fall depending on how the candle pressure is acting.
The Doji Candle
The doji is a small candle with a tiny body and a wick on both sides. The dogi is easy to spot and usually signals indecision or a turn in direction. It means the candle opened and closed near the same price but shot up and down during that same candle.
There are many different candle patterns and I will not cover those in this book. A simple google search will give you tons of information on candle patterns and what they mean. I’m going to focus on reading and feeling the candles in terms of pressure and overall pattern in the chart.
Overall the candles tell a story of the past. They plot the history of the movement of the chart. When trading binary options in short time frames, you will need to focus on candle pressure and indicators to give you the clue to make place a winning trade position.
Studying all of the different typical candle names and patterns may help you some, but the only way to really learn to read the chart movements for making short binary trades is to focus on the candle pressure. The candle pressure will usually tell you so much more when you take time to learn to read. It takes a lot of time practicing in demo applying strategies and getting familiar with candle movement to start winning trades.
Just like I will mention in the following chapters about indicators, no one single pattern or setup is a guarantee for a win. You can have the perfect little setup in the candle or indicator and place a perfect trade according to any textbook strategy and still find that you get a loss. Because of this, it’s best not to assume that your perfect setups are 100% wins in binary options. In the chapter on the martingale, I’ll help you understand how to still win even when your perfect trade occasionally results in a loss.
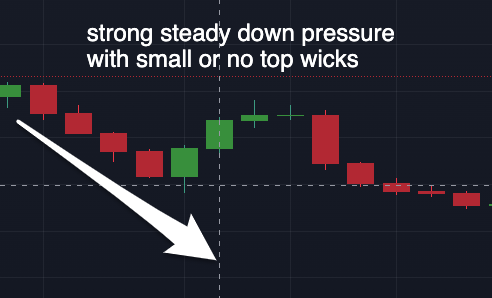
When reading charts, you will start to recognize patterns and your mind will begin to put the pieces together to help you make winning trades. For example, the 4 red candles pushing down with very small or no signs of top wicks means that this is a strong down pressure and you could have won a put on the 3rd or 4th candle position. Those are nice slow moving medium body red candles with small wicks. That’s a good sign of steady down pressure.
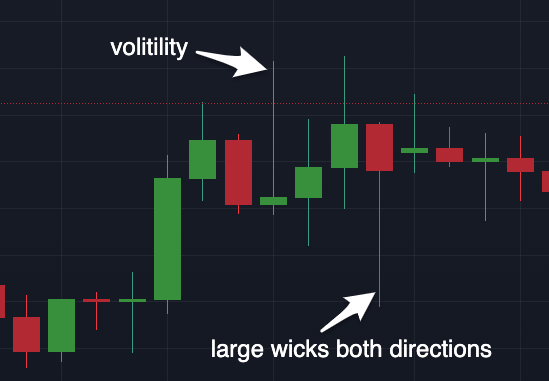
On the other hand, the picture below shows a chart with a lot of volatility. The large wicks show that the price is jumping up and down within the same candle and closing close to the middle. On the small green candle with the large wick, the price jumped way up and then was pushed back down. Then a few candles later the price plummeted and was pushed back up. This chart will also look crazy when you are watching it and you will have a hard time guessing what it will do next. It’s best to stay away from placing trades in this type of volatility and it’s easy to spot.
the best trading sheets are here!
To learn more, get my new book Binary Options Trading Strategy and buy my trading sheets